Climate Change in California: Facts, Effects and Solutions | Energy Upgrade California

What Is Climate Change?

Climate patterns are changing, in California and across the planet. Since the mid 20th century, climate scientists have tracked these global warming trends and attributed them largely to human activity on the planet. That activity (our use of fossil fuels) has resulted in dramatically increased levels of carbon dioxide and other greenhouse gases in the atmosphere.

In California, much of the state’s energy still comes from our dependence on fossil fuels like natural gas and oil. When fossil fuels are burned, carbon dioxide, methane and other greenhouse gases are released into the air. These greenhouse gases, such as methane, are also released during fossil fuel extraction and transportation. Carbon dioxide isn’t harmful at natural levels, but too much can act like a layer of plastic wrap around the Earth that lets in heat from the sun but doesn’t let it escape. The atmosphere acts like a greenhouse, which is why these emissions are called greenhouse gases.

How Is Climate Change Affecting California?

In California, there are several areas of impact from climate change:

We can expect more frequent and longer heat waves, and drier summers. Smog forms faster in warmer weather, creating a health hazard for all of us, especially infants, children and the elderly.

chart shows the number of extreme heat days (10 days to 110 days)from 1950 to the year 3000 in 10 year increments. The chart also notes that the historical average number of extreme heat days is 4 and that the extreme heat day threshold is 97 degrees Fahrenheit. The chart shows that, in Los Angeles, the number of extreme heat days is projected to increase exponentially over time from a past norm of around 10 days to a future norm of over 80 days and growing. chart shows the number of extreme heat days (10 days to 110 days)from 1950 to the year 3000 in 10 year increments. The chart also notes that the historical average number of extreme heat days is 4 and that the extreme heat day threshold is 97 degrees Fahrenheit. The chart shows that, in San Diego, the number of extreme heat days is projected to increase exponentially over time from a past norm of around 10 days to a future norm of over 80 days and growing. chart shows the number of extreme heat days (10 days to 110 days)from 1950 to the year 3000 in 10 year increments. The chart also notes that the historical average number of extreme heat days is 4 and that the extreme heat day threshold is 97 degrees Fahrenheit. The chart shows that, in San Francisco, the number of extreme heat days is projected to increase exponentially over time from a past norm of around 10 days to a future norm of over 80 days and growing

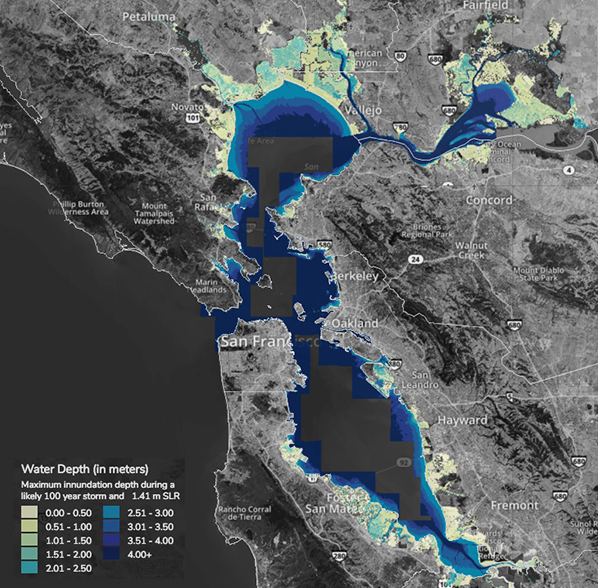
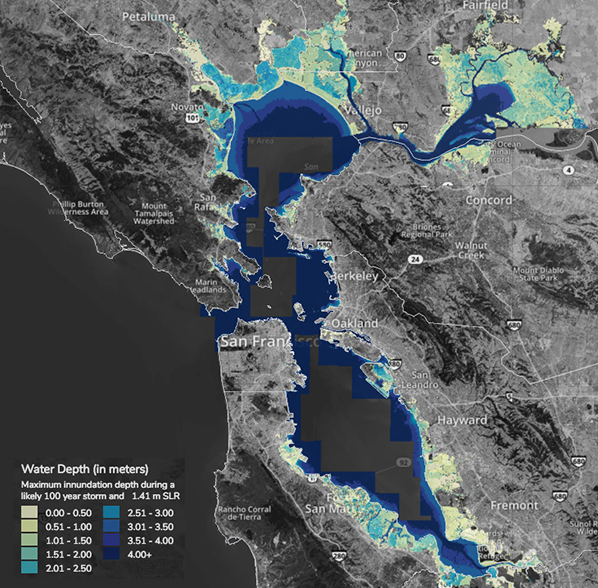
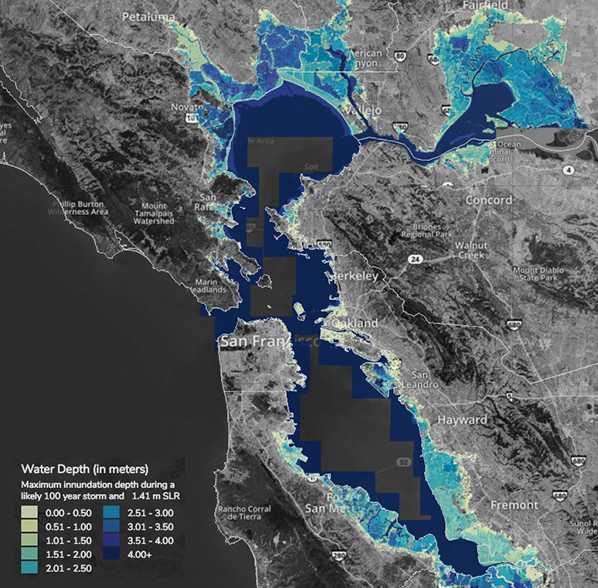
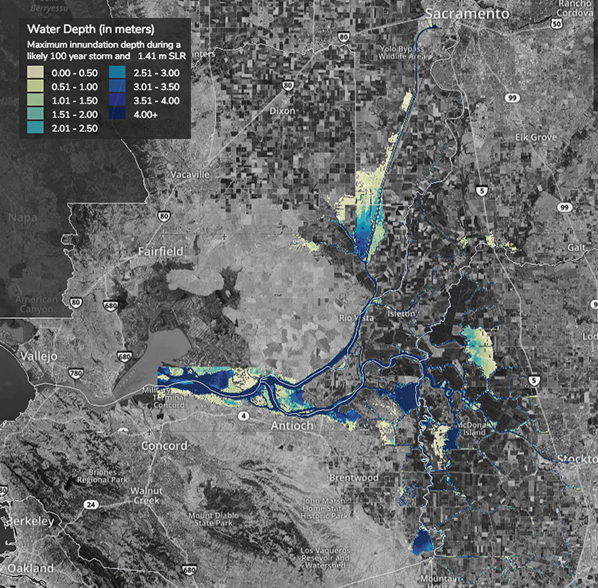
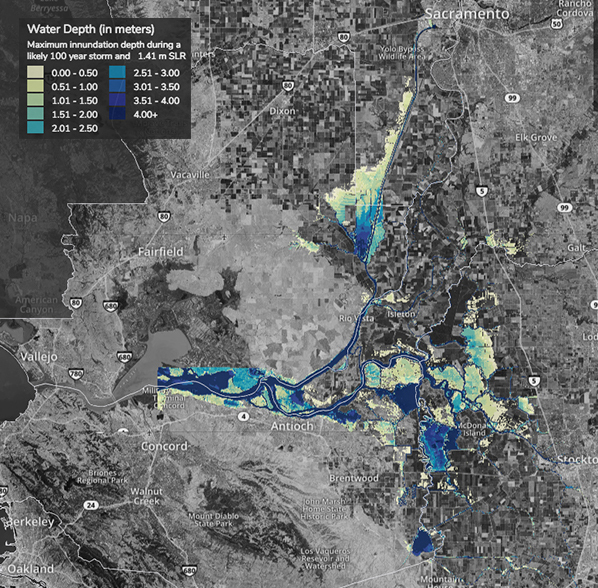
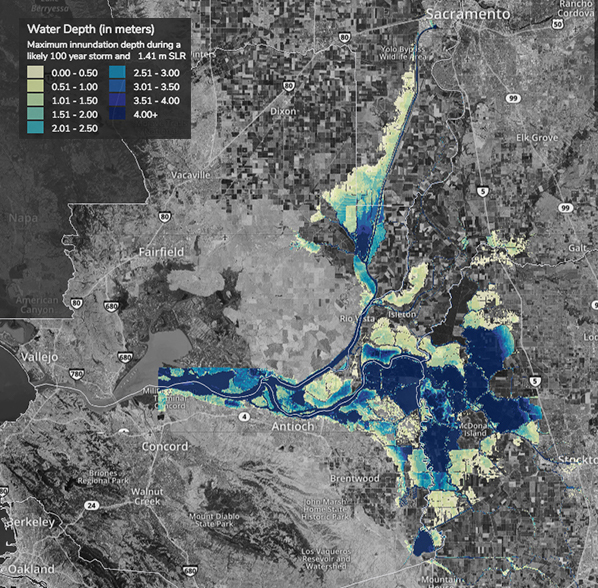
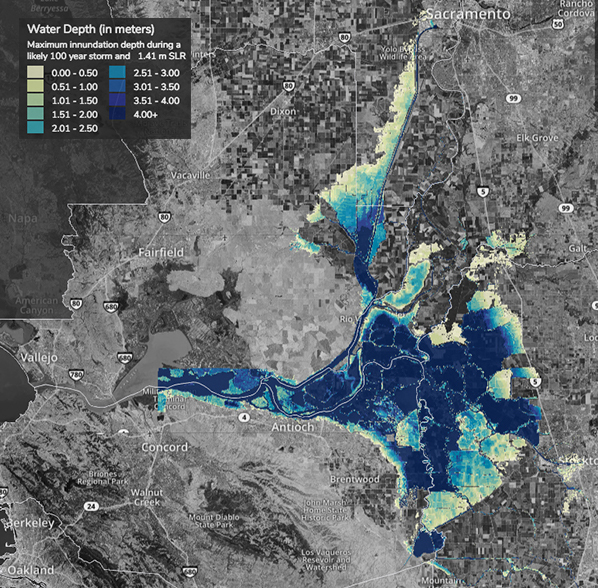
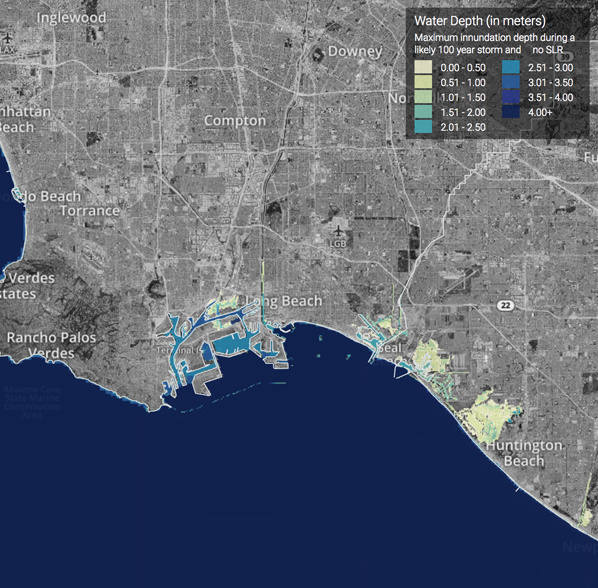
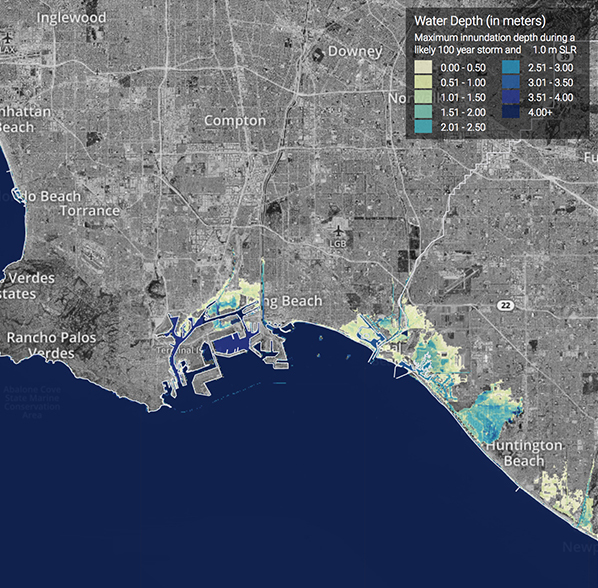
Sea levels are predicted to rise up to eight feet over the next 100 years. This could cause significant flooding and erosion of hundreds of miles of coastline, greatly impacting homes, agricultural lands and low-lying cities.

As rain patterns change, forests will become drier and susceptible to more frequent and intense fires. These fires will add even more carbon to the atmosphere, further accelerating climate change.

map of San Francisco Bay Area showing water depth, in meters, and associated maximum innundation depth during a likely 100 year storm and 1.41 sea level rise. Map shows highlighted areas mostly along the coastline of the San Francisco Bay and it's tributaries. map of San Francisco Bay Area showing water depth, in meters, and associated maximum innundation depth during a likely 100 year storm and 1.41 sea level rise. Map shows highlighted areas along the coastline, initially shown with no rise, now expanding further inland along the coastline of the San Francisco Bay and it's tributaries. map of San Francisco Bay Area showing water depth, in meters, and associated maximum innundation depth during a likely 100 year storm and 1.41 sea level rise. Map shows highlighted areas along the coastline, initially shown with .5 meter rise, now with more severity and expanding further inland along the coastline of the San Francisco Bay and it's tributaries. map of San Francisco Bay Area showing water depth, in meters, and associated maximum innundation depth during a likely 100 year storm and 1.41 sea level rise. Map shows highlighted areas along the coastline, initially shown with 1.0 meter rise, now with even more severity and expanding further inland along the coastline of the San Francisco Bay and it's tributaries. map of Sacramento-San Joaquin Delta Area showing water depth, in meters, and associated maximum innundation depth during a likely 100 year storm and 1.41 sea level rise. Map shows highlighted areas mostly along the coastline of the Sacramento-San Joaquin Delta and it's tributaries. map of Sacramento-San Joaquin Delta Area showing water depth, in meters, and associated maximum innundation depth during a likely 100 year storm and 1.41 sea level rise. Map shows highlighted areas along the coastline, initially shown with no rise, now expanding further inland along the coastline of the Sacramento-San Joaquin Delta and it's tributaries. map of Sacramento-San Joaquin Delta Area showing water depth, in meters, and associated maximum innundation depth during a likely 100 year storm and 1.41 sea level rise. Map shows highlighted areas along the coastline, initially shown with .5 meter rise, now with more severity and expanding further inland along the coastline of the Sacramento-San Joaquin Delta and it's tributaries. map of Sacramento-San Joaquin Delta Area showing water depth, in meters, and associated maximum innundation depth during a likely 100 year storm and 1.41 sea level rise. Map shows highlighted areas along the coastline, initially shown with 1.0 meter rise, now with even more severity and expanding further inland along the coastline of the Sacramento-San Joaquin Delta and it's tributaries. map of California Coast Area showing water depth, in meters, and associated maximum innundation depth during a likely 100 year storm and 1.41 sea level rise. Map shows highlighted areas mostly along the coastline of the California Coast and it's tributaries. map of California Coast Area showing water depth, in meters, and associated maximum innundation depth during a likely 100 year storm and 1.41 sea level rise. Map shows highlighted areas along the coastline, initially shown with no rise, now expanding further inland along the coastline of the California Coast and it's tributaries. map of California Coast Area showing water depth, in meters, and associated maximum innundation depth during a likely 100 year storm and 1.41 sea level rise. Map shows highlighted areas along the coastline, initially shown with .5 meter rise, now with more severity and expanding further inland along the coastline of the California Coast and it's tributaries. map of California Coast Area showing water depth, in meters, and associated maximum innundation depth during a likely 100 year storm and 1.41 sea level rise. Map shows highlighted areas along the coastline, initially shown with 1.0 meter rise, now with even more severity and expanding further inland along the coastline of the California Coast and it's tributaries.

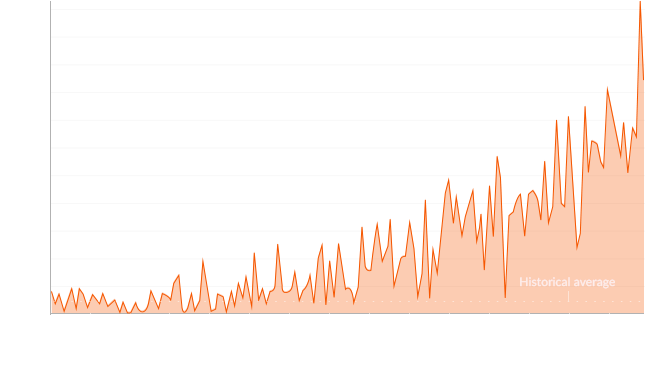
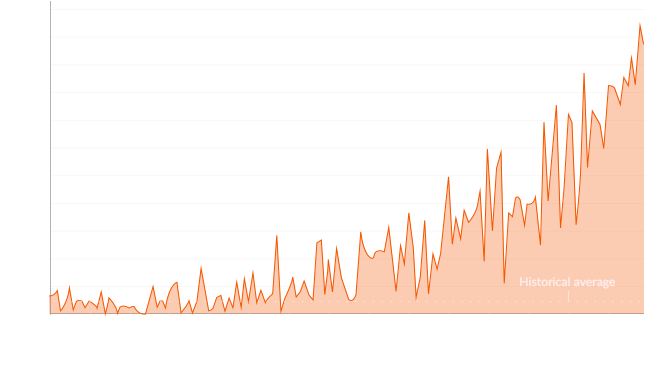
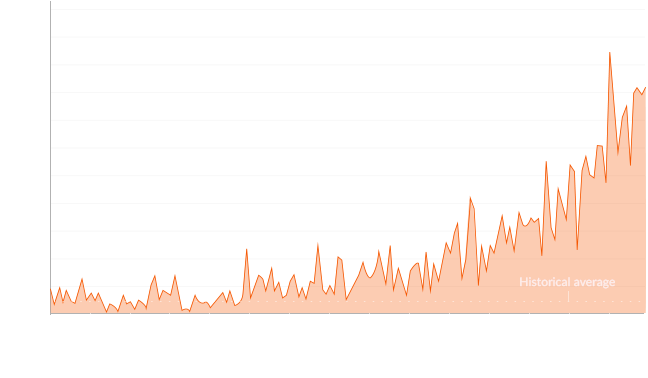
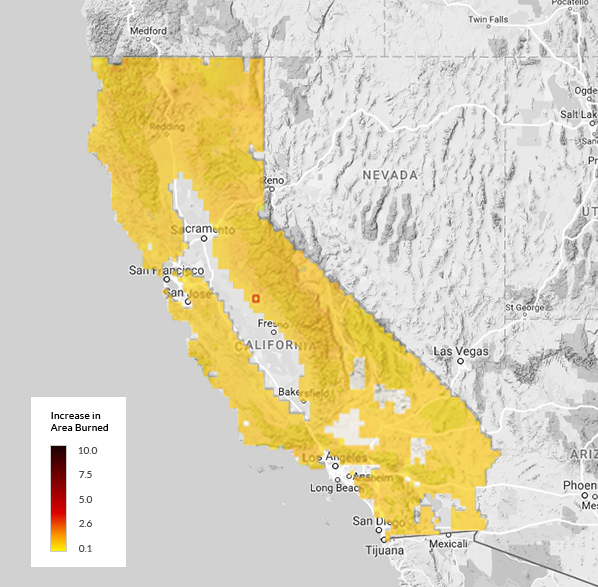
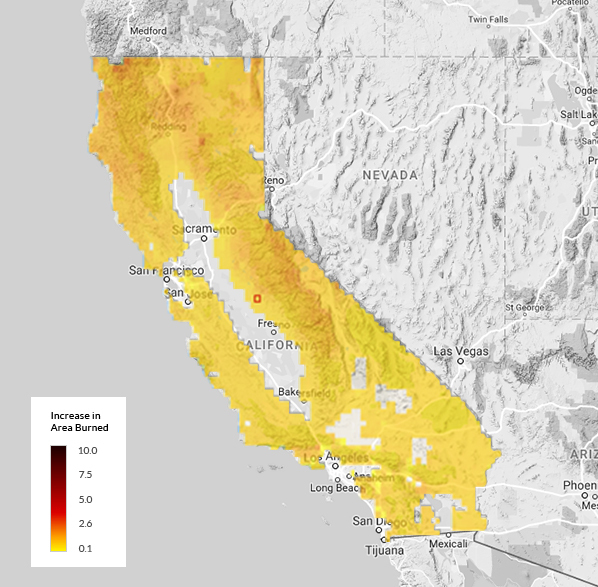
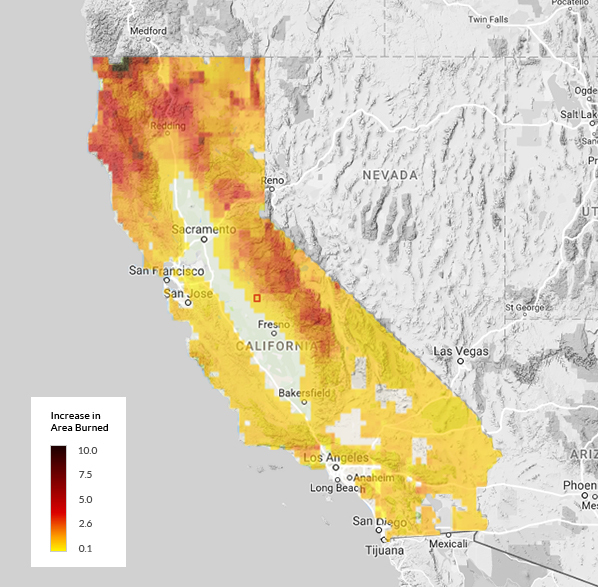
The data in this climate tool display the projected increase in potential area burned given three different climate models and two different scenarios. Darker oranges and reds suggest up to a 10-fold increase in potential area burned. As rain patterns change, forests will become drier and susceptible to more frequent and intense fires. These fires will add even more carbon to the atmosphere, further accelerating climate change. In recent years, extreme drought and heat have killed off over 100 million trees, completely destroying many of California’s treasured forests, and increasing the likelihood of more fires.

map of the state of California showing an Increase in area burned map key with a color indicator from .1 (yellow) to a 10 fold increase (dark red). With 2020 selected, the map shows a majority of the state highlighted in yellow map of the state of California showing an Increase in area burned map key with a color indicator from .1 (yellow) to a 10 fold increase (dark red). With 2050 selected, the map shows an update to a majority of the state to have a slight increase in area burned map of the state of California showing an Increase in area burned map key with a color indicator from .1 (yellow) to a 10 fold increase (dark red). With 2080 selected, the map shows a majority of the upper half of the state with a significant increase in area burned

Keeping California Golden

No other state in the U.S. can match what California offers in terms of natural beauty, miles of coastline and idyllic weather. We’re also home to world-renowned entrepreneurs, inventors and dreamers—the kind of people who believe we can do anything once we set our minds to it. It’s easy to see why we love living in California. But the California we love is threatened. Climate change is already contributing to increased air pollution, deforestation, ocean acidification, more wildfires, droughts, heat waves and sea-level rise, which threaten our health, our livelihoods and our future. Scientists and other experts agree that we need to reduce carbon pollution if we are to avoid the worst effects of climate change, and there’s no time to waste. We have to find ways to work together to make real, substantive changes to protect what we have today and preserve our natural resources for future generations.

We’re Leading the Way to a Clean Energy Future

So how do we achieve such an ambitious goal? It will take effort and dedication from every Californian and company doing business here. We all need to play a part in successfully increasing energy efficiency, embracing clean energy and supporting clean technology. In achieving these goals, we’ll also enjoy the benefits that come with being early adopters of a clean-energy future. Besides fighting the effects of climate change, our collective efforts can boost our local economy by keeping clean-energy investments, jobs and innovation in California.

What Can You Do About Climate Change?

There are things each of us can do to minimize our environmental impact. In California, our biggest areas of individual impact are related to reducing our energy use in homes, cars and businesses, while better leveraging the cleaner energy resources available across the state.

Energy Upgrade California® is making it easier for you to reduce your carbon footprint by providing you with a variety of ways to save energy and water. Your utility and municipality may also provide rebates and other resources to help you take action.

It doesn’t take much to make a huge difference if all of us get involved. If every American home replaced one incandescent light bulb with a new ENERGY STAR energy-saving LED bulb, the Environmental Protection Agency (EPA) estimates that we could save enough energy to power three million homes for a year, save about $680 million in annual energy costs and eliminate nine billion pounds of greenhouse gas emissions per year.

Home Energy Efficiency

Saving energy doesn’t have to be hard. Check out these simple tips to help you take action, save energy and protect California.
Learn More

Small changes make a big difference

It’s easier than you think to save energy and these simple tips will show you how.
Learn More