기후 변화 | Energy Upgrade California

기후 변화란 무엇입니까?

캘리포니아와 지구 전역의 기후 패턴이 변화하고 있습니다. 20세기 중반 이후 기후 과학자들은 이러한 지구 온난화 추세 를 추적해왔고, 그 원인을 대부분 지구에서 벌이는 인간의 활동에서 찾고 있습니다. 그러한 활동(화석연료의 사용)으로 인해 결국 지구에서 이산화탄소와 기타 온실 가스가 극적으로 증가하게 되었습니다.

캘리포니아의 경우, 주 대부분의 에너지는 아직도 천연가스와 석유 같은 화석 연료에 기대는 실정입니다. 화석연료가 연소될 때, 이산화탄소, 메탄, 기타 온실 가스가 대기 중으로 배출됩니다. 또한 메탄 같은 온실 가스는 화석연료 추출과 수송 중에도 배출됩니다. 이산화탄소는 정상적인 수준에서는 해롭지 않지만, 지나치면 지구를 둘러싼 플라스틱 랩처럼 작용하여 태양열이 들어오지만 빠져나가지 못하게 만들 수 있습니다. 대기가 마치 온실처럼 작용하는데, 이 때문에 이러한 배출물을 온실 가스라고 부릅니다.

기후 변화는 캘리포니아에 어떻게 영향을 미치고 있나요?

캘리포니아에서는 기후 변화가 다양한 영역에 영향을 미치고 있습니다.

이에 열파는 더욱 잦고 길어지며 여름이 더욱 건조해질 것으로 예상할 수 있습니다. 스모그는 날씨가 따뜻할수록 더욱 빠르게 형성되어 우리 모두, 특히 유아, 어린이, 노년층의 건강에 유해한 요소로 작용합니다.

chart shows the number of extreme heat days (10 days to 110 days)from 1950 to the year 3000 in 10 year increments. The chart also notes that the historical average number of extreme heat days is 4 and that the extreme heat day threshold is 97 degrees Fahrenheit. The chart shows that, in Los Angeles, the number of extreme heat days is projected to increase exponentially over time from a past norm of around 10 days to a future norm of over 80 days and growing. chart shows the number of extreme heat days (10 days to 110 days)from 1950 to the year 3000 in 10 year increments. The chart also notes that the historical average number of extreme heat days is 4 and that the extreme heat day threshold is 97 degrees Fahrenheit. The chart shows that, in San Diego, the number of extreme heat days is projected to increase exponentially over time from a past norm of around 10 days to a future norm of over 80 days and growing. chart shows the number of extreme heat days (10 days to 110 days)from 1950 to the year 3000 in 10 year increments. The chart also notes that the historical average number of extreme heat days is 4 and that the extreme heat day threshold is 97 degrees Fahrenheit. The chart shows that, in San Francisco, the number of extreme heat days is projected to increase exponentially over time from a past norm of around 10 days to a future norm of over 80 days and growing

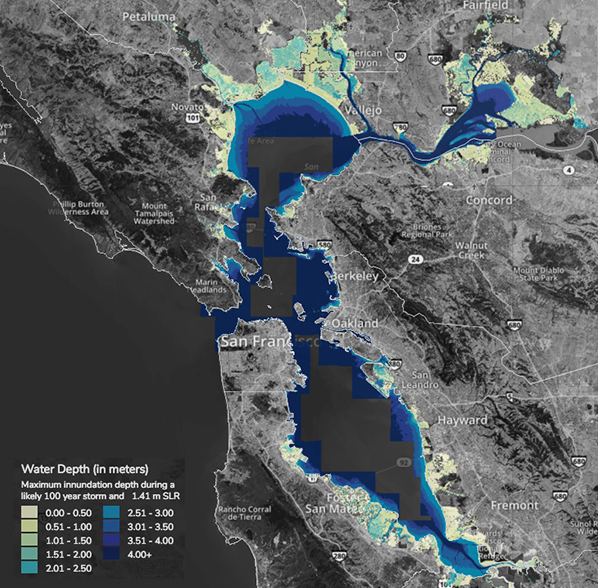
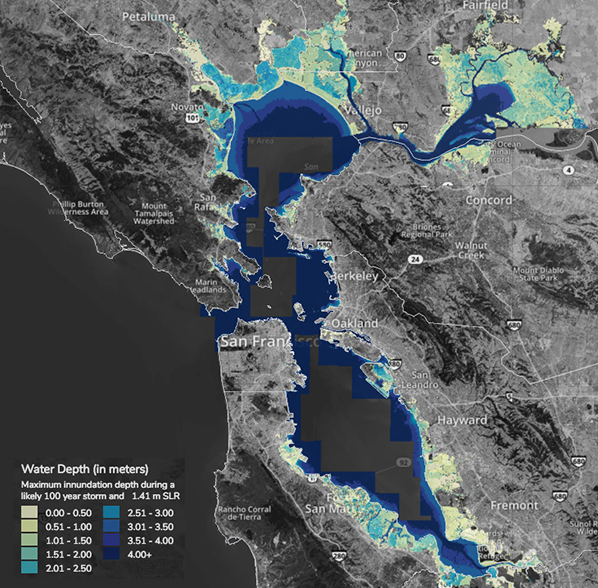
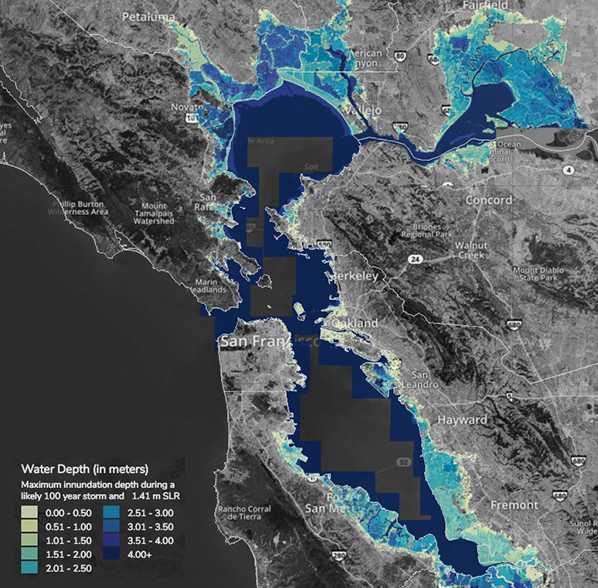
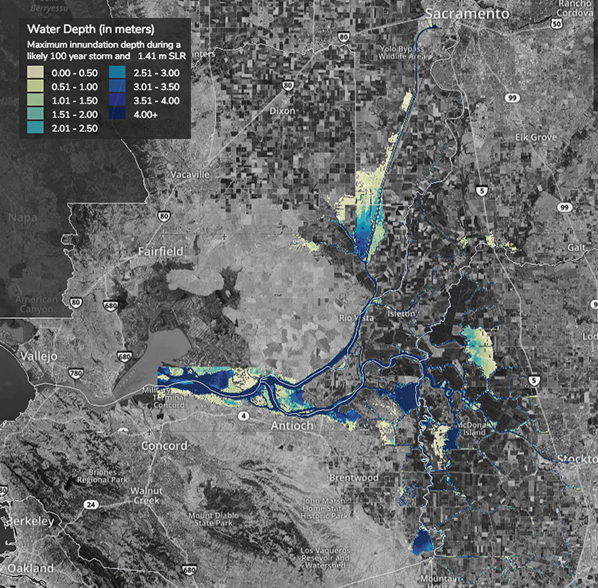
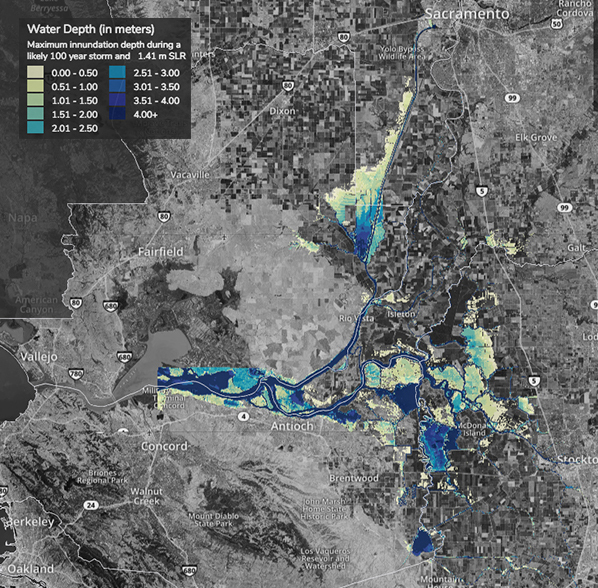
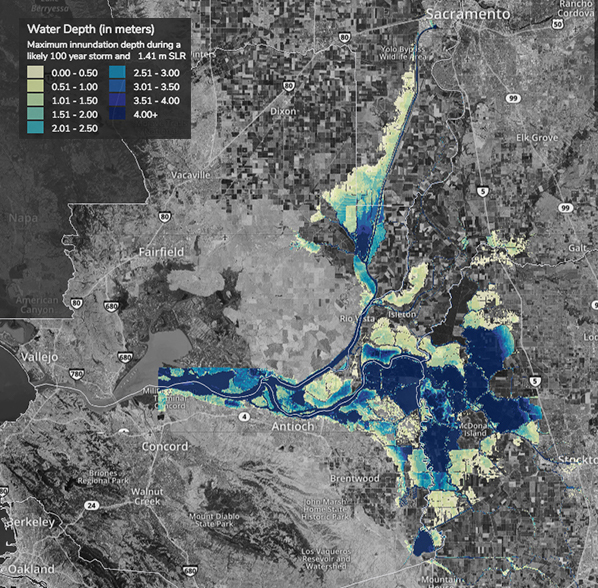
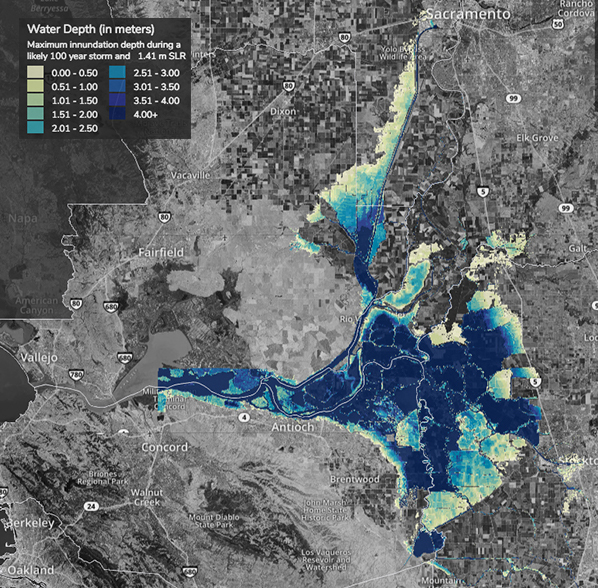
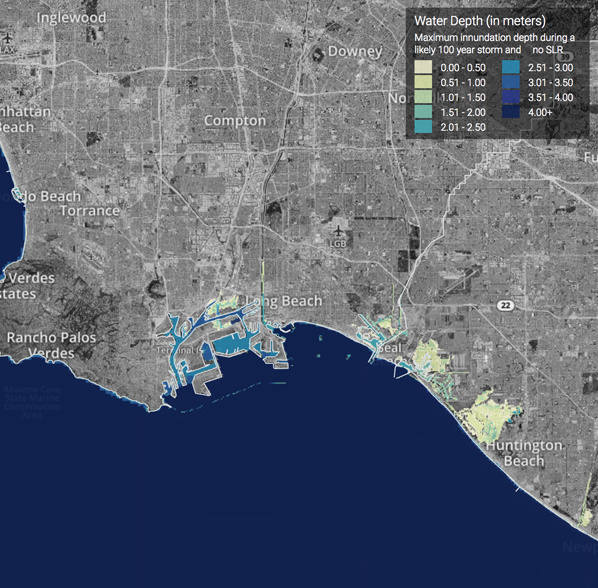
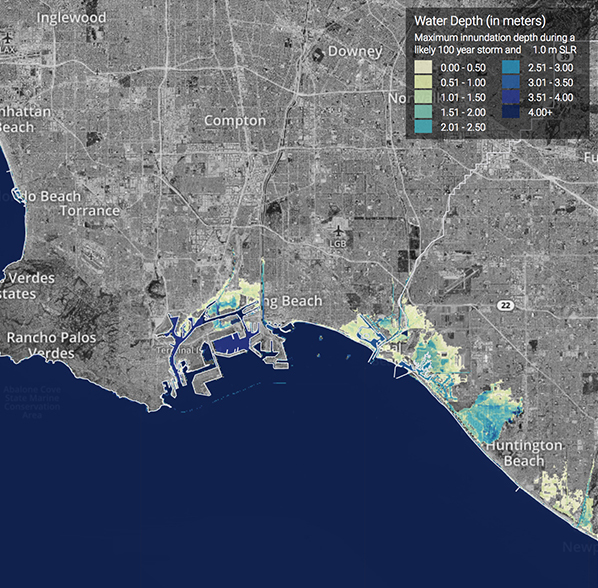
해수면은 향후 100년에 걸쳐 최대 8피트까지 상승할 것으로 예측됩니다. 이 때문에 홍수가 심해지고 수백만 마일의 해안선이 침식되어 주택이나 농경지 그리고 저지대 도시에 큰 영향을 줄 수 있습니다.

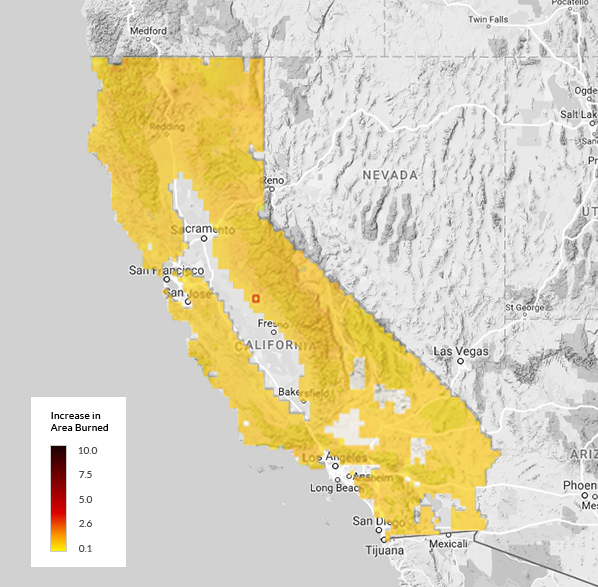
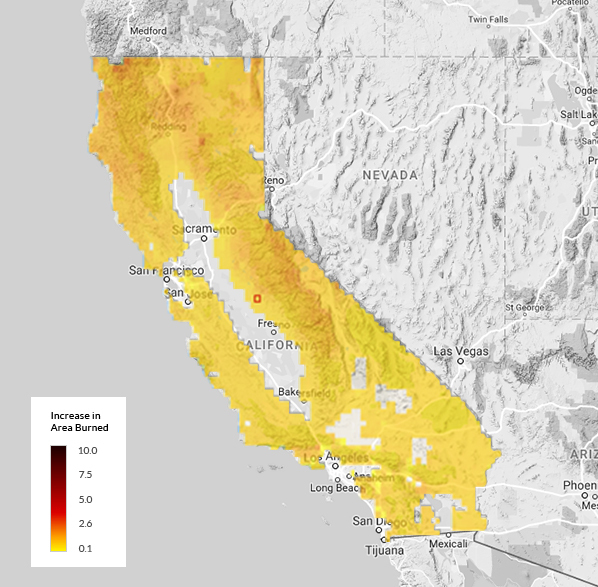
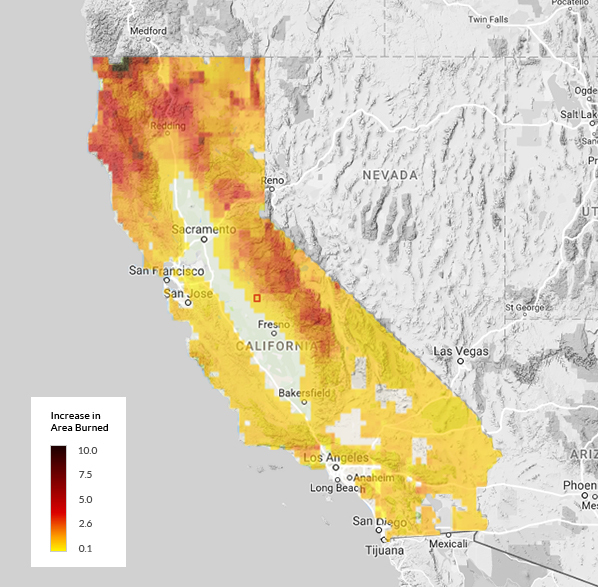
산불 증가: 강수 패턴이 변화함에 따라, 삼림이 더욱 건조해져 더 자주 극심한 화재에 취약해질 것입니다. 이러한 화재는 대기에 더 많은 탄소를 배출하며 기후 변화를 한층 가속화시킬 것입니다.

map of San Francisco Bay Area showing water depth, in meters, and associated maximum innundation depth during a likely 100 year storm and 1.41 sea level rise. Map shows highlighted areas mostly along the coastline of the San Francisco Bay and it's tributaries. map of San Francisco Bay Area showing water depth, in meters, and associated maximum innundation depth during a likely 100 year storm and 1.41 sea level rise. Map shows highlighted areas along the coastline, initially shown with no rise, now expanding further inland along the coastline of the San Francisco Bay and it's tributaries. map of San Francisco Bay Area showing water depth, in meters, and associated maximum innundation depth during a likely 100 year storm and 1.41 sea level rise. Map shows highlighted areas along the coastline, initially shown with .5 meter rise, now with more severity and expanding further inland along the coastline of the San Francisco Bay and it's tributaries. map of San Francisco Bay Area showing water depth, in meters, and associated maximum innundation depth during a likely 100 year storm and 1.41 sea level rise. Map shows highlighted areas along the coastline, initially shown with 1.0 meter rise, now with even more severity and expanding further inland along the coastline of the San Francisco Bay and it's tributaries. map of Sacramento-San Joaquin Delta Area showing water depth, in meters, and associated maximum innundation depth during a likely 100 year storm and 1.41 sea level rise. Map shows highlighted areas mostly along the coastline of the Sacramento-San Joaquin Delta and it's tributaries. map of Sacramento-San Joaquin Delta Area showing water depth, in meters, and associated maximum innundation depth during a likely 100 year storm and 1.41 sea level rise. Map shows highlighted areas along the coastline, initially shown with no rise, now expanding further inland along the coastline of the Sacramento-San Joaquin Delta and it's tributaries. map of Sacramento-San Joaquin Delta Area showing water depth, in meters, and associated maximum innundation depth during a likely 100 year storm and 1.41 sea level rise. Map shows highlighted areas along the coastline, initially shown with .5 meter rise, now with more severity and expanding further inland along the coastline of the Sacramento-San Joaquin Delta and it's tributaries. map of Sacramento-San Joaquin Delta Area showing water depth, in meters, and associated maximum innundation depth during a likely 100 year storm and 1.41 sea level rise. Map shows highlighted areas along the coastline, initially shown with 1.0 meter rise, now with even more severity and expanding further inland along the coastline of the Sacramento-San Joaquin Delta and it's tributaries. map of California Coast Area showing water depth, in meters, and associated maximum innundation depth during a likely 100 year storm and 1.41 sea level rise. Map shows highlighted areas mostly along the coastline of the California Coast and it's tributaries. map of California Coast Area showing water depth, in meters, and associated maximum innundation depth during a likely 100 year storm and 1.41 sea level rise. Map shows highlighted areas along the coastline, initially shown with no rise, now expanding further inland along the coastline of the California Coast and it's tributaries. map of California Coast Area showing water depth, in meters, and associated maximum innundation depth during a likely 100 year storm and 1.41 sea level rise. Map shows highlighted areas along the coastline, initially shown with .5 meter rise, now with more severity and expanding further inland along the coastline of the California Coast and it's tributaries. map of California Coast Area showing water depth, in meters, and associated maximum innundation depth during a likely 100 year storm and 1.41 sea level rise. Map shows highlighted areas along the coastline, initially shown with 1.0 meter rise, now with even more severity and expanding further inland along the coastline of the California Coast and it's tributaries.

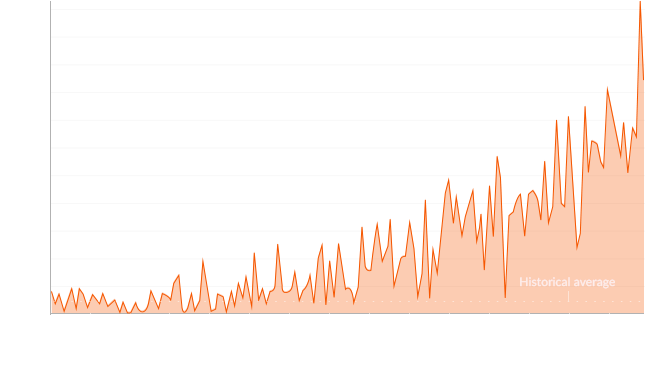
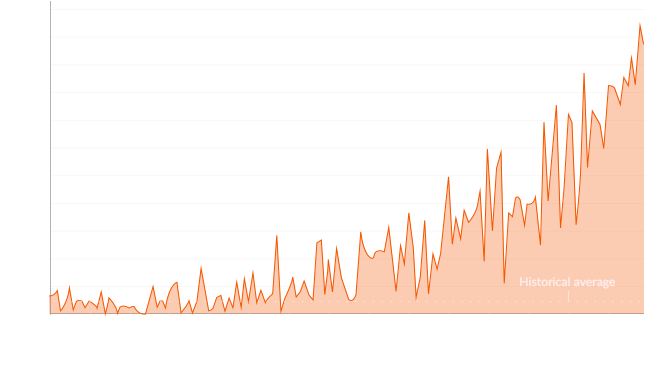
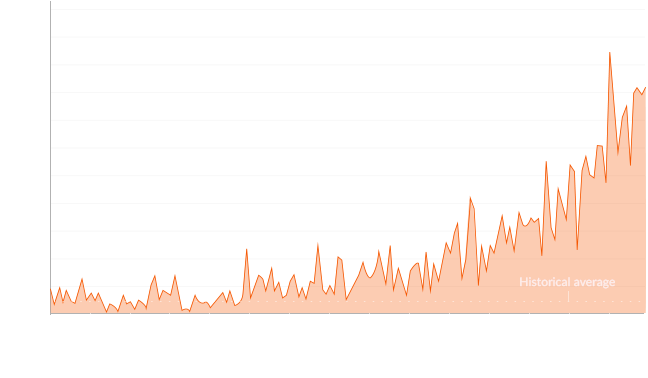
이 기후 툴에 나타난 데이터는 세 개의 상이한 기후 모델과 두 개의 서로 다른 시나리오를 바탕으로 연소된 지역이 잠재적으로 얼마나 증가하는지를 예측해서 보여줍니다. 상대적으로 짙은 주황색과 적색은 연소된 잠재 지역이 최대 10배 증가했음을 나타냅니다.

map of the state of California showing an Increase in area burned map key with a color indicator from .1 (yellow) to a 10 fold increase (dark red). With 2020 selected, the map shows a majority of the state highlighted in yellow map of the state of California showing an Increase in area burned map key with a color indicator from .1 (yellow) to a 10 fold increase (dark red). With 2050 selected, the map shows an update to a majority of the state to have a slight increase in area burned map of the state of California showing an Increase in area burned map key with a color indicator from .1 (yellow) to a 10 fold increase (dark red). With 2080 selected, the map shows a majority of the upper half of the state with a significant increase in area burned

캘리포니아의 황금빛을 지켜라

자연의 아름다움, 수 마일에 걸쳐 펼쳐진 해안 지대 그리고 목가적인 날씨를 놓고 볼 때 캘리포니아가 선사하는 것에 비견되는 곳은 미국 내에 어떤 주도 없습니다. 또한 캘리포니아는 세계적으로 유명한 기업가, 발명가, 그리고 마음만 먹었다 하면 어떤 것이든 할 수 있다고 믿는 그런 꿈꾸는 이들의 고향과도 같은 곳입니다. 캘리포니아에서 사는 것을 좋아하는 이유는 어렵지 않게 확인됩니다. 그러나 우리가 사랑하는 캘리포니아가 위협받고 있습니다.기후 변화 는 이미 공기 오염 증가, 삼림 파괴, 해양 산성화, 산불 증가, 가뭄, 열파 그리고 해수면 상승의 원인이 되어 우리의 건강, 생계 수단과 우리의 미래를 위협하고 있습니다. 과학자와 기타 전문가들은 기후 변화로 인한 최악의 결과를 피하고 싶다면 탄소 오염을 줄어야 하며, 낭비할 시간이 없다는 것에 일치된 의견을 보입니다. 힘을 모아 제대로 된 실질적 변화를 단행함으로써 지금의 우리를 보호하고 미래 세대를 위해 천연 자원을 보존할 방안을 강구해야 합니다.

우리는 청정 에너지의 미래로 나아가는 방법을 주도하고 있습니다

그러한 원대한 목표는 어떻게 달성할까요? 모든 캘리포니아 주민과 이곳에서 사업을 영위하는 기업의 노력과 헌신이 필요할 것입니다. 우리 모두는 성공적으로 에너지 효율성을 높이고 청정 에너지를 채택해 청정 기술을 지원하는 데 있어 일정한 역할을 수행해야 합니다. 이 목표를 달성하는 과정에서 우리는 청정 에너지의 미래를 조기에 수용하면서 부수적인 혜택 또한 누리게 될 것입니다. 기후 변화의 영향을 줄이는 것 외에도 캘리포니아에서 청정 에너지에 투자하고 일자리를 지키며 혁신을 이어감으로써 우리의 집단적 노력이 지역 경제를 살릴 수 있습니다.

기후 변화에 맞서 무엇을 할 수 있을까요?

환경에 미치는 영향을 최소로 하기 위해 개개인이 실천할 수 있는 일들이 있습니다. 캘리포니아에서 개인이 가장 큰 영향을 줄 수 있는 분야는 집, 자동차 및 사업체에서의 에너지 사용을 줄이는 동시에 주 전체에서 사용 가능한 청정 에너지 자원을 더 잘 활용하는 것과 관련이 있습니다.

Energy Upgrade California®는 에너지와 물을 절약하는 다양한 방법을 제공함으로써 탄소 발자국을 보다 쉽게 줄일 수 있도록 지원합니다. 공공기관과 시 당국은 환급금 과 기타 리소스를 제공해 활동에 도움을 드릴 수 있습니다.

모두가 참여한다면 큰 변화를 만드는 것은 어렵지 않습니다. 모든 미국 가정에서 한 개의 백열등을 새로운 ENERGY STAR 에너지 절감형 LED 전구로 교체하는 경우, 환경보호국(EPA)은 일년 동안 3백만 가구에 전력을 공급할 정도로 충분히 에너지를 절감할 수 있고, 연간 에너지 비용을 6억 8천만 달러 가량 절약할 수 있으며, 매년 90억 파운드의 온실 가스 배출량을 줄일 수 있다고 평가합니다.


주택 에너지 효율

에너지 절약은 어렵지 않습니다. 행동을 취하고 에너지를 절약하며 캘리포니아를 보호하는 데 도움이 되는 이 간단한 팁을 확인해보세요.
자세히 알아보기

작은 변화가 큰 차이를 만듭니다

에너지를 절약하는 것은 생각보다 쉽습니다. 이 간단한 팁을 통해 가능합니다.
자세히 보기